原始内容
Claude Code OpenTelemetry for pi


One observability stack for every coding agent
Your telemetry should not fragment when your tools do.
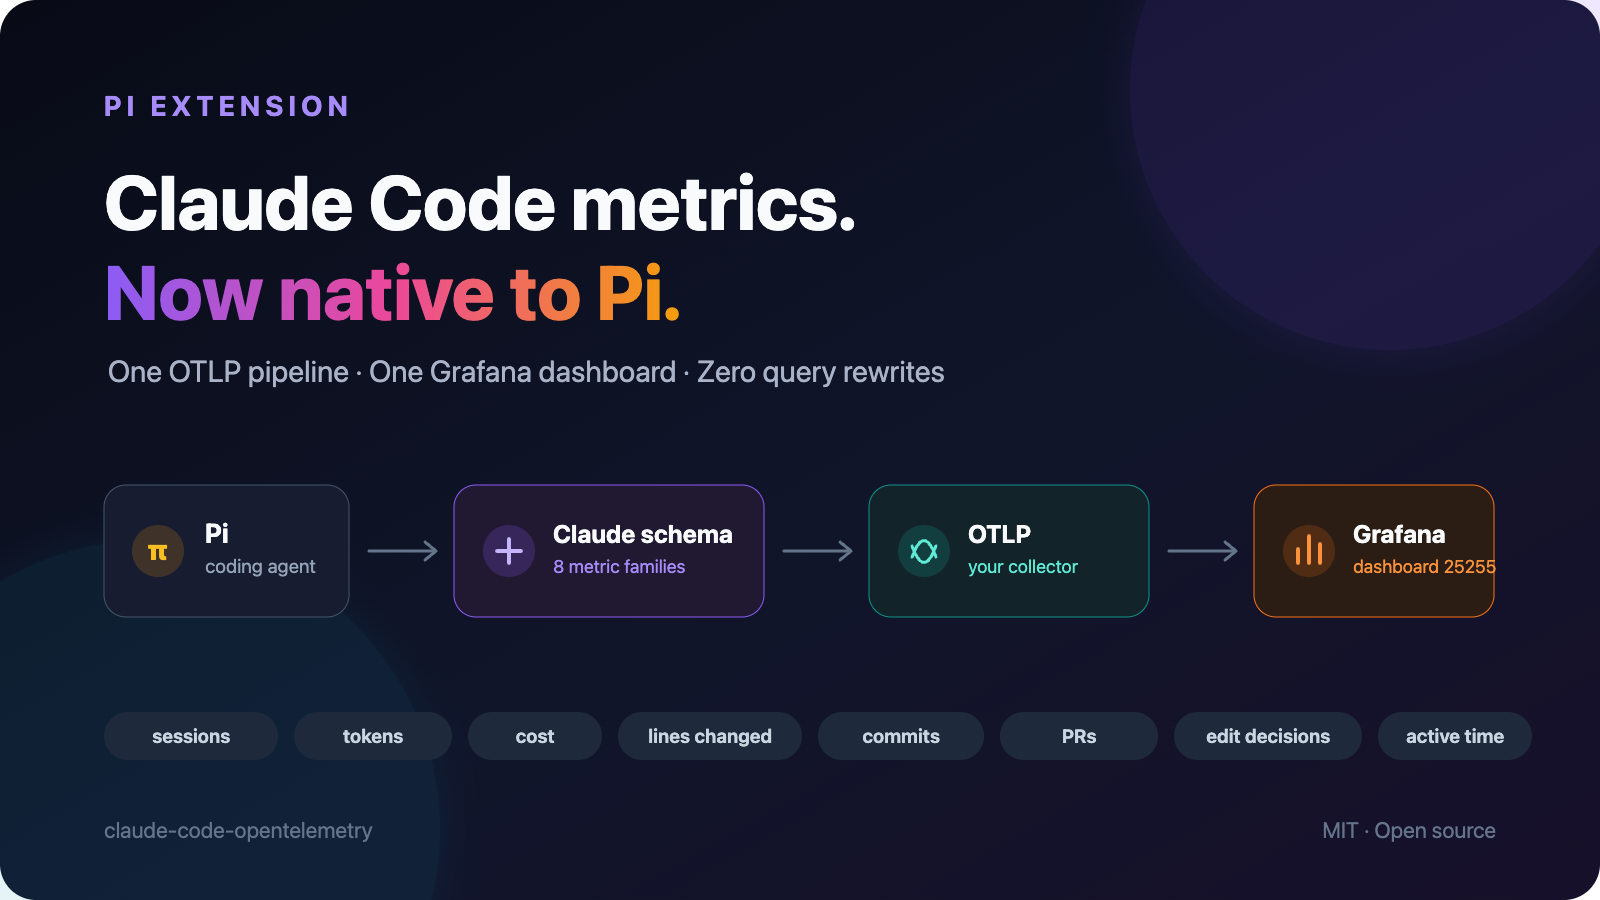
This pi package makes pi speak Claude Code's OpenTelemetry metrics language: same eight metric families, same units, and dashboard-compatible attributes. Pi lands in your existing collector, Prometheus backend, and Grafana dashboard 25255 beside Claude Code.
One install. No migration. No second dashboard.
Install in one command
pi install npm:claude-code-opentelemetry
Restart pi. Existing Claude Code telemetry configuration is reused automatically.
Already exporting Claude Code metrics? Install, restart, done. Extension reads same
CLAUDE_CODE_ENABLE_TELEMETRYandOTEL_*environment variables.
Why teams choose it
| Without this extension | With this extension |
|---|---|
Separate pi_* metrics and dashboards |
Claude Code-compatible metric schema |
| Collector transforms and recording rules | Direct OTLP/HTTP protobuf export |
| Split cost and usage views | Pi and Claude Code in dashboard 25255 |
| Custom maintenance burden | Standard pi package updates |
| Unclear approximation semantics | Explicit, documented compatibility contract |
pi update npm:claude-code-opentelemetry
Quick start
1. Configure OTLP metrics
export CLAUDE_CODE_ENABLE_TELEMETRY=1
export OTEL_METRICS_EXPORTER=otlp
export OTEL_EXPORTER_OTLP_PROTOCOL=http/protobuf
export OTEL_EXPORTER_OTLP_ENDPOINT=http://localhost:4318
export OTEL_EXPORTER_OTLP_METRICS_TEMPORALITY_PREFERENCE=cumulative
Extension sends OTLP/HTTP protobuf to http://localhost:4318/v1/metrics. Default export interval is 60 seconds; set OTEL_METRIC_EXPORT_INTERVAL to change it.
2. Run pi
pi
3. Import Grafana dashboard 25255
- Open Dashboards → New → Import in Grafana.
- Enter dashboard ID 25255.
- Select Prometheus-compatible data source receiving your collector's metrics.
Pi data appears under service_name="pi-coding-agent". Existing Claude Code data remains unchanged.
What gets exported
| OpenTelemetry metric | Prometheus series used by dashboard 25255 | Measures |
|---|---|---|
claude_code.session.count |
claude_code_session_count_total |
Sessions started |
claude_code.token.usage |
claude_code_token_usage_tokens_total |
Input, output, cache-read, and cache-creation tokens |
claude_code.cost.usage |
claude_code_cost_usage_USD_total |
Provider-reported cost in USD |
claude_code.lines_of_code.count |
claude_code_lines_of_code_count_total |
Added and removed lines |
claude_code.commit.count |
claude_code_commit_count_total |
Git commits created |
claude_code.pull_request.count |
claude_code_pull_request_count_total |
GitHub pull requests and GitLab merge requests created |
claude_code.code_edit_tool.decision |
claude_code_code_edit_tool_decision_total |
Successful edit/write decisions |
claude_code.active_time.total |
claude_code_active_time_seconds_total |
CLI and estimated user-active seconds |
Dashboard attributes include organization_id, user_email, session_id, model, type, decision, and language. Zero-valued series are initialized at session start so every dashboard panel is discoverable before its first matching action.
Compatibility contract
This project targets Claude Code metrics and Grafana compatibility, not behavioral identity.
| Signal | Pi measurement |
|---|---|
| Session start | Mapped to fresh, resume, or continue from pi lifecycle events |
| Token usage | Taken from each assistant turn's pi usage block |
| Cost | Taken from provider-reported pi turn cost |
| Lines changed | Diffed locally before and after successful Edit/Write operations |
| Commits | Counted only when an observed git commit advances HEAD |
| Pull requests | Counted only when successful gh pr create or glab mr create output contains a new PR/MR URL |
| Edit decisions | Emitted as accept with source config; pi has no Claude Code permission-decision event |
| CLI active time | Measured wall-clock agent processing time |
| User active time | Bounded interaction estimate; pi does not expose Claude Code's keyboard-focus tracker |
These differences are deliberate and documented. Metric names, units, and dashboard-facing attributes remain compatible; Pi-specific observations use closest available semantics.
Configuration
Exporters
OTEL_METRICS_EXPORTER accepts comma-separated values:
otlp— OTLP/HTTP protobufconsole— diagnostic output to stderr/stdoutnone— disabled
This extension exports metrics only. It does not emit Claude Code events, logs, or beta traces. Set OTEL_TRACES_EXPORTER=none when your collector has no traces pipeline.
Endpoints
| Variable | Behavior |
|---|---|
OTEL_EXPORTER_OTLP_ENDPOINT |
Generic endpoint; extension appends /v1/metrics |
OTEL_EXPORTER_OTLP_METRICS_ENDPOINT |
Metrics-specific endpoint; used verbatim and takes precedence |
Examples:
# Generic OTLP/HTTP endpoint
export OTEL_EXPORTER_OTLP_ENDPOINT=https://otel.example.com
# Sends to https://otel.example.com/v1/metrics

# Explicit metrics endpoint
export OTEL_EXPORTER_OTLP_METRICS_ENDPOINT=https://otel.example.com/custom/metrics
Authentication headers
Generic and metrics-specific OTLP headers are supported. Metrics-specific values override duplicate generic keys.
export OTEL_EXPORTER_OTLP_HEADERS='Authorization=Bearer%20token'
# or
export OTEL_EXPORTER_OTLP_METRICS_HEADERS='Authorization=Bearer%20token'
Percent-encoded names and values are decoded before export. Headers are passed only to configured OTLP endpoint and never recorded as metric attributes.
Identity and cardinality
| Attribute | Source |
|---|---|
organization.id |
CLAUDE_CODE_ORGANIZATION_ID; otherwise first label of Git email domain; otherwise local |
user.email |
Global git config user.email, when available |
user.id |
Random installation ID stored with mode 0600 under ~/.pi/agent/state/otel-user-id |
session.id |
Pi session UUID |
terminal.type |
Terminal environment |
| Resource attributes | OTEL_RESOURCE_ATTRIBUTES |
Claude-compatible cardinality controls:
OTEL_METRICS_INCLUDE_SESSION_ID— defaulttrueOTEL_METRICS_INCLUDE_VERSION— defaultfalseOTEL_METRICS_INCLUDE_ENTRYPOINT— defaultfalseOTEL_METRICS_INCLUDE_RESOURCE_ATTRIBUTES— defaulttrue
Custom resource attributes cannot override built-in standard attributes.
Collector example
No collector change is required when Grafana dashboard 25255 already works for Claude Code. For a new OpenTelemetry Collector deployment, this minimal pipeline forwards OTLP metrics to Prometheus remote write:
receivers:
  otlp:
    protocols:
      http:
        endpoint: 0.0.0.0:4318

processors:
  batch: {}

exporters:
  prometheusremotewrite:
    endpoint: https://prometheus.example.com/api/v1/write
    resource_to_telemetry_conversion:
      enabled: true

service:
  pipelines:
    metrics:
      receivers: [otlp]
      processors: [batch]
      exporters: [prometheusremotewrite]
resource_to_telemetry_conversion exposes resource attributes such as service.name as Prometheus labels such as service_name, which dashboard 25255 queries.
Privacy model
Extension exports numeric metrics and metadata—not conversation or code content.
Never exported:
- prompts or assistant responses
- source-code contents or file paths
- tool arguments or tool output
- shell commands
- API keys or OTLP header values
To calculate line deltas and detect commits/PRs, extension inspects edited files and relevant tool results locally in memory. Raw content is discarded after measurement and never sent to collector.
Exported metadata can include Git email, hostname, anonymous installation ID, session ID, model, terminal type, language, and custom OTEL_RESOURCE_ATTRIBUTES. Review collector access and retention policy before team-wide deployment. See SECURITY.md for trust boundaries and private reporting.
Verify and troubleshoot
Inside pi:
/claude-metrics-status
Expected status shows active metrics endpoint. Query Prometheus-compatible backend:
claude_code_session_count_total{service_name="pi-coding-agent"}
If no series appears:
- Confirm
CLAUDE_CODE_ENABLE_TELEMETRY=1. - Confirm
OTEL_METRICS_EXPORTERincludesotlporconsole. - Confirm generic or metrics-specific endpoint is set.
- Wait one export interval, or exit pi to force a final flush.
- Check collector logs for rejected OTLP requests.
Development
git clone https://github.com/xiaoxianma/claude-code-opentelemetry.git
cd claude-code-opentelemetry
npm install
npm run check
pi -e ./src/index.ts
Repository layout:
src/              extension and metric helpers
test/             behavior tests
media/            package-gallery and README artwork
.github/workflows continuous integration
Contributions are welcome. Read CONTRIBUTING.md before opening a pull request.
License
MIT © xiaoxianma
Not affiliated with Anthropic, Grafana Labs, or pi maintainers. Claude Code and Grafana are trademarks of their respective owners.