原始内容
Codetographer

Ask your AI assistant how something works. Get a visual map that links back to the code.
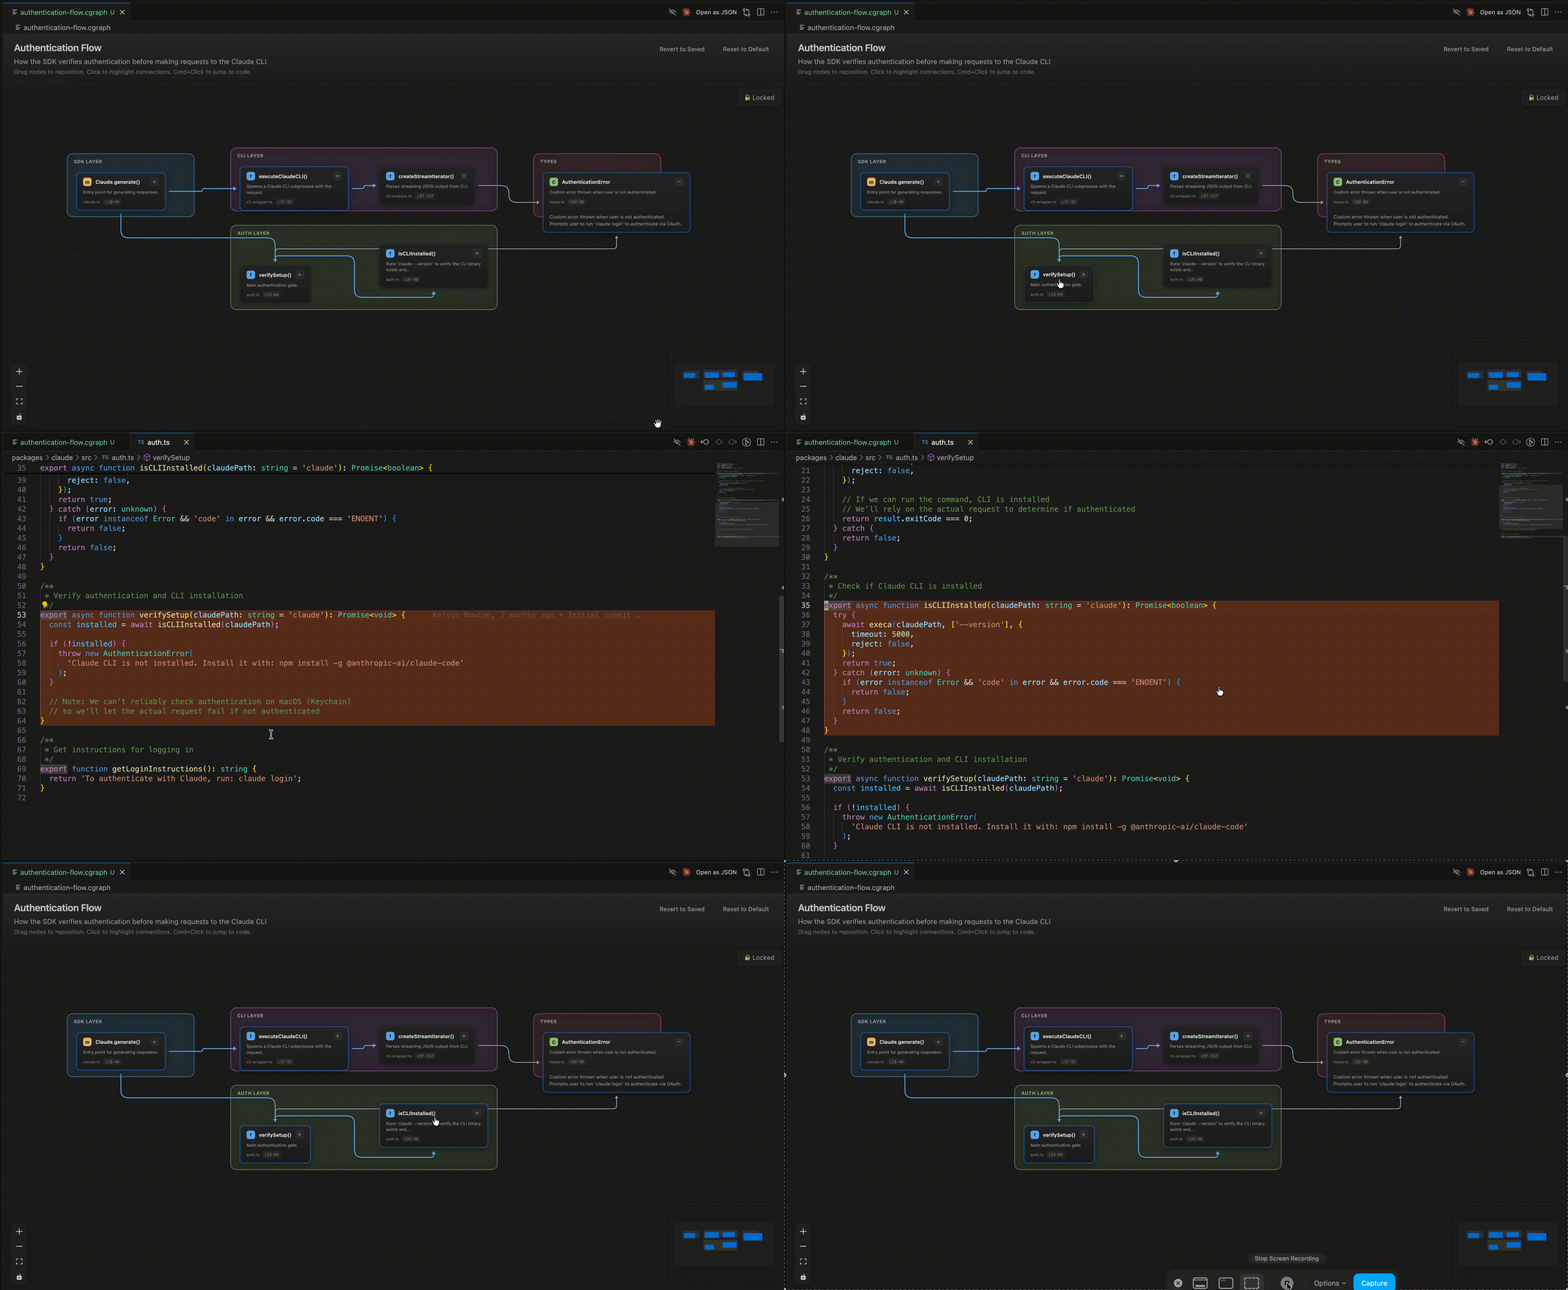
What is this?
Understanding unfamiliar codebases is hard. You ask your AI "how does authentication work?" and get back a wall of text explaining different files and functions. By the time you've read through it, you've forgotten where it started.
Codetographer takes a different approach. Instead of text explanations, your AI generates an interactive visual map of the code flow. Each node in the graph represents a real function or class in your codebase, and clicking it takes you directly to that code.
The workflow is simple: install the extension, give your AI assistant the skill file, then ask questions like you normally would. When you ask "how does X work?", you get a .cgraph file that opens as a navigable diagram.
Getting Started
Install the Extension
git clone https://github.com/Kelvination/codetographer.git
cd codetographer
pnpm install        # or npm/yarn
pnpm setup          # one-time setup
pnpm build:local    # build and install
Marketplace release coming soon.
Add the AI Skill
For Claude Code:
mkdir -p .claude/skills
cp path/to/codetographer/skill/SKILL.md .claude/skills/codetographer.md
For other AI assistants:
Use skill/SKILL.md as a prompt or system instruction. The skill tells the AI how to generate .cgraph files when you ask about code architecture.
Try it
Once set up, ask your AI things like:
- "How does user authentication work?"
- "Show me the data flow for order processing"
- "Create a graph of the API routes"
The AI will create a .cgraph file that automatically opens as an interactive graph.
How It Works
The basics
- You ask your AI assistant a question about how something in the code works
- The AI analyzes the relevant code and creates a
.cgraphfile - VS Code opens the file and renders it as an interactive graph
- Each node links to the actual code—click to jump there
Under the hood
.cgraph files are JSON documents containing:
- Nodes: Functions, classes, or modules with labels, descriptions, and file locations (path + line numbers)
- Edges: Relationships between nodes (calls, imports, extends, etc.)
- Layout: Direction and grouping hints
When you Cmd+Click (Ctrl+Click) a node, the extension tells VS Code to open that file at the exact line. The graph layout is computed automatically using ELK.js.
Interacting with Graphs
| Action | Result |
|---|---|
| Click a node | Highlights connected nodes, dims others |
| Cmd+Click / Ctrl+Click | Opens file at that code location |
Click the + button |
Expands the node's full description |
| Drag | Pan around the graph |
| Scroll / pinch | Zoom in and out |
| Bottom-left controls | Zoom buttons, fit to view |
The .cgraph Format
Schema Reference (click to expand)
Basic Structure
{
  "version": "1.0",
  "metadata": {
    "title": "Graph Title",
    "description": "What this graph shows",
    "generated": "2025-01-01T00:00:00Z",
    "scope": "src/relevant/path"
  },
  "nodes": [...],
  "edges": [...],
  "groups": [...],
  "layout": {
    "type": "layered",
    "direction": "TB"
  },
  "legend": {...}
}
Nodes
{
  "id": "unique-id",
  "label": "functionName()",
  "type": "function",
  "description": "What this does",
  "location": {
    "file": "src/path/to/file.ts",
    "startLine": 42,
    "endLine": 67
  },
  "group": "optional-group-id"
}
Node types: function, method, class, module, file
Edges
{
  "id": "edge-1",
  "source": "source-node-id",
  "target": "target-node-id",
  "type": "calls",
  "importance": "primary",
  "color": "#ff6b6b"
}
Edge types: calls, imports, extends, implements, uses
Importance levels: primary (thick), secondary (normal), tertiary (thin)
Groups
Groups create visual sections for organizing related nodes:
{
  "id": "api-layer",
  "label": "API Layer",
  "description": "HTTP request handlers"
}
Assign nodes to groups with the group field.
Layout Options
Types:
layered(default): Hierarchical tree, good for call flowsforce: Compact web layout, good for interconnected systemsstress: Even spacing, good for general relationships
Directions (for layered): TB (top-bottom), LR (left-right), BT, RL
Legend
"legend": {
  "title": "Data Flow",
  "items": [
    { "color": "#ff6b6b", "label": "Write operations" },
    { "color": "#4ecdc4", "label": "Read operations" }
  ]
}
Development
Quick Start
pnpm install        # install dependencies
pnpm setup          # one-time setup (installs vsce)
pnpm build:local    # build, package, and install locally
Commands
| Command | Description |
|---|---|
pnpm setup |
One-time dev setup |
pnpm build |
Build extension and webview |
pnpm build:local |
Build, package, and install to VS Code/Cursor |
pnpm package |
Create .vsix package |
Testing
Quick testing: Run pnpm build:local to build and install. The script auto-detects VS Code vs Cursor and can reload your window automatically.
Debugging: Use VS Code's Run and Debug panel → select "Run Extension (Watch)". This launches an Extension Development Host with automatic rebuilds.
Project Structure
codetographer/
├── extension/          # VS Code extension (TypeScript)
│   ├── src/
│   │   ├── extension.ts
│   │   └── cgraphEditorProvider.ts
│   └── media/          # Built webview assets
├── webview/            # React app for graph rendering
│   └── src/
│       ├── components/
│       │   ├── GraphCanvas.tsx
│       │   └── CodeNode.tsx
│       └── hooks/
├── skill/              # AI skill for generating graphs
│   └── SKILL.md
└── scripts/            # Build utilities
License
Apache 2.0 - see LICENSE for details.